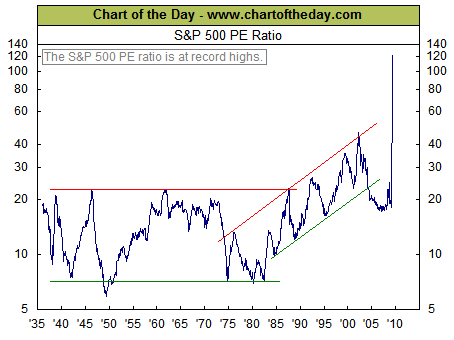
Keep in mind folks P/E's are not very useful as market predictors or as market timing mechanisms. The chart shown above is quite interesting though, what you're looking at is not inflation, since the chart graphs the ratio of the inflated prices divided by the inflated earnings and is thus automatically adjusted for inflation. It does appear however to reflect the growing "Virtual Economy™" and it also appears to show that people are willing to pay more and more money for stocks at progressively higher and higher multiples of P/E's, the question would be why would they do that? Why would they pay more for what appears to be an ever shrinking portion of the "Real Economy" – mpg
For more on this issue see also....Effective Fed Funds Rate & Total Non-Farm Payrolls 03-24-07 - mpg